Lesson 2: Statistics
Trading Card: Captain Scat
Julie Gele artist

Lesson notes from YTA Founder: Statistics is a key component of achieving scientific progress, in that it is frequently used to define the rules by which scientific conclusions will be accepted by the general scientific community. If it were not for these types of rules, and statistics, scientific progress would be slowed to an unacceptable degree by disagreements. Thus while these rules can lead to incorrect conclusions due to random chance, a balance is reached by setting statistical targets in such a way as to reduce the frequency of incorrect conclusions while maintaining scientific progress.
I start the Statistics lesson in the YTA program with a description of the timeline for educational milestones from Kindergarten through Ph.D., to give the children an idea of the educational path to successfully beginning science and technology careers. When discussing this timeline I note the breakout points at which the career can be started. After a BS/BA one can start some careers, or if one chooses to become a Ph.D. scientist, another 5-10 years of school will be necessary. I ask the children why a scientist needs to spend 5-10 years more in school to become a scientist, after already going to school for 17 years from kindergarten to BS/BA. We discuss the answers, and eventually I tell them that although there is much knowledge that is learned while working towards a Ph.D., the bulk of time is spent learning to "prove" ideas. Most people, whether in science or not, can come up with a hypothesis, but proving to a group of scientists that a novel hypothesis is correct is a skill that takes much time to develop and demonstrate. And this is the lead-in to the lesson topic, statistics, a type of math that is critical for "proving" hypotheses.
One side-note here. I could have a longer discussion with the children about all the different types of degrees and options, and perhaps there are exceptions to the educational timeline I present to the children that can be discussed. But if I take the time to give the most accurate information, the children would miss most of the points and I would not achieve my main goal, to get the children thinking logically. The educational timeline is presented in part, to give the children an idea of how long it takes to become a scientist. After achieving this I often take the opportunity to ask the children, "Is science fun?". They are usually quite surprised to find that my answer to this question is "no". Science is hard work, and kids can accept this and still want to become scientists. It is a challenge that they can meet, I tell them, and along the way they will find the journey to be interesting, fascinating, useful, rewarding...but not fun.
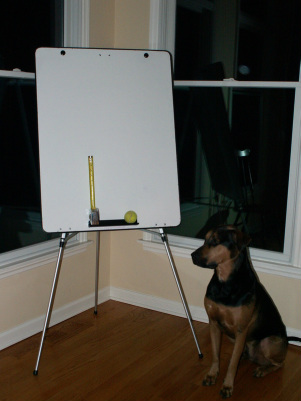
Following the discussion on the education timeline for those choosing to pursue science/technology careers, I begin to discuss statistics by proposing a hypothesis; If I drop a ball from a high height it will bounce higher than if I drop it from a low height. The class then tests this hypothesis by making the measurements and plotting them on a graph. During the analysis of the graph we discover that we really need a "Statistical Rule" for determining whether a hypothesis is correct or incorrect, or else we will find it difficult to make conclusions that most can accept. I use the range of the data to construct the rule, since most students that will receive the lessons (usually 3rd grade and above) have learned the definition for the range of a data set. Most YTA lesson plans indicate the need for a white board or similar means to write and display information (see materials for the Statistics lesson in the picture below, with my trusty assistant Tom). I always write the keywords, concepts, and models on the white board so children can refer to them when I ask them to logically explain observations in a lesson. For the Statistics lesson I write the agreed upon Statistical Rule on the board for future reference.
We go on to use this definition to test another hypothesis; a child will jump further with two feet than with one foot. The students first generate one data point for each type of jumping and I ask the kids if there is a significant difference based on our rule. Of course we cannot really establish a range with one data point, so we conclude that more data is necessary. We continue to generate the data to test the hypothesis, and we eventually obtain about 5 data points for each type of jump. Then we use our statistical rule to judge the data. It is important to engage the students in the conversation, explaining or repeating the explanation of why the conclusion is valid.
We then play with the rule for determining statistical significance, after seeing the data. If we concluded that there was a difference in the distance jumped in the prior study, then I increase the size of the range so that the ranges for jumping with one and both feet now overlap. If we concluded there was no difference then I shrink the ranges dramatically so that they no longer overlap, and our conclusion becomes that there is in fact a difference in the distance jumped. Of course these are post-hoc rules constructed after the data was looked at, and therefore not scientifically valid.....in fact it is cheating. I always try to get the students to say that this is so. I ask them, "is it OK in science to make the statistical rule after you look at the data? Why or why not?". Remember that any thinking is good thinking, just as falling off the bike is a prelude to riding it. So if students are puzzled, I periodically repeat the question, perhaps in different ways, to keep them thinking. Even if the lesson goes over in time, or needs to be stopped short because the 45 minutes are up; if it went over because of good discussion of ideas and intense thinking, the lesson was a success.
The Statistics lesson ends by asking the children for hypotheses that they have about anything. For example a good one that was suggested at one of my lessons was to test whether a baseball is hit further by a composite or aluminum baseball bat. I then asked the student to come up to the board and describe how he would test this, from the details of the actual experiment through making a graph and comparing the ranges for the data. I guided him minimally when necessary (in the name of time), but I also allowed his brain to practice thinking for 10-20 seconds in silent pauses when I could see him thinking.
I start the Statistics lesson in the YTA program with a description of the timeline for educational milestones from Kindergarten through Ph.D., to give the children an idea of the educational path to successfully beginning science and technology careers. When discussing this timeline I note the breakout points at which the career can be started. After a BS/BA one can start some careers, or if one chooses to become a Ph.D. scientist, another 5-10 years of school will be necessary. I ask the children why a scientist needs to spend 5-10 years more in school to become a scientist, after already going to school for 17 years from kindergarten to BS/BA. We discuss the answers, and eventually I tell them that although there is much knowledge that is learned while working towards a Ph.D., the bulk of time is spent learning to "prove" ideas. Most people, whether in science or not, can come up with a hypothesis, but proving to a group of scientists that a novel hypothesis is correct is a skill that takes much time to develop and demonstrate. And this is the lead-in to the lesson topic, statistics, a type of math that is critical for "proving" hypotheses.
One side-note here. I could have a longer discussion with the children about all the different types of degrees and options, and perhaps there are exceptions to the educational timeline I present to the children that can be discussed. But if I take the time to give the most accurate information, the children would miss most of the points and I would not achieve my main goal, to get the children thinking logically. The educational timeline is presented in part, to give the children an idea of how long it takes to become a scientist. After achieving this I often take the opportunity to ask the children, "Is science fun?". They are usually quite surprised to find that my answer to this question is "no". Science is hard work, and kids can accept this and still want to become scientists. It is a challenge that they can meet, I tell them, and along the way they will find the journey to be interesting, fascinating, useful, rewarding...but not fun.
Following the discussion on the education timeline for those choosing to pursue science/technology careers, I begin to discuss statistics by proposing a hypothesis; If I drop a ball from a high height it will bounce higher than if I drop it from a low height. The class then tests this hypothesis by making the measurements and plotting them on a graph. During the analysis of the graph we discover that we really need a "Statistical Rule" for determining whether a hypothesis is correct or incorrect, or else we will find it difficult to make conclusions that most can accept. I use the range of the data to construct the rule, since most students that will receive the lessons (usually 3rd grade and above) have learned the definition for the range of a data set. Most YTA lesson plans indicate the need for a white board or similar means to write and display information (see materials for the Statistics lesson in the picture below, with my trusty assistant Tom). I always write the keywords, concepts, and models on the white board so children can refer to them when I ask them to logically explain observations in a lesson. For the Statistics lesson I write the agreed upon Statistical Rule on the board for future reference.
We go on to use this definition to test another hypothesis; a child will jump further with two feet than with one foot. The students first generate one data point for each type of jumping and I ask the kids if there is a significant difference based on our rule. Of course we cannot really establish a range with one data point, so we conclude that more data is necessary. We continue to generate the data to test the hypothesis, and we eventually obtain about 5 data points for each type of jump. Then we use our statistical rule to judge the data. It is important to engage the students in the conversation, explaining or repeating the explanation of why the conclusion is valid.
We then play with the rule for determining statistical significance, after seeing the data. If we concluded that there was a difference in the distance jumped in the prior study, then I increase the size of the range so that the ranges for jumping with one and both feet now overlap. If we concluded there was no difference then I shrink the ranges dramatically so that they no longer overlap, and our conclusion becomes that there is in fact a difference in the distance jumped. Of course these are post-hoc rules constructed after the data was looked at, and therefore not scientifically valid.....in fact it is cheating. I always try to get the students to say that this is so. I ask them, "is it OK in science to make the statistical rule after you look at the data? Why or why not?". Remember that any thinking is good thinking, just as falling off the bike is a prelude to riding it. So if students are puzzled, I periodically repeat the question, perhaps in different ways, to keep them thinking. Even if the lesson goes over in time, or needs to be stopped short because the 45 minutes are up; if it went over because of good discussion of ideas and intense thinking, the lesson was a success.
The Statistics lesson ends by asking the children for hypotheses that they have about anything. For example a good one that was suggested at one of my lessons was to test whether a baseball is hit further by a composite or aluminum baseball bat. I then asked the student to come up to the board and describe how he would test this, from the details of the actual experiment through making a graph and comparing the ranges for the data. I guided him minimally when necessary (in the name of time), but I also allowed his brain to practice thinking for 10-20 seconds in silent pauses when I could see him thinking.
Lesson 2 Plan
| statistics.pdf |
Lesson 2 Trading Card
| lesson_2_trading_card.pptx |
